
Watching a Model Answer
Standard service metrics showed whether the chat assistant was available and responsive, but not whether its answers were safe or useful. The observability work added metrics for response quality and safety signals.
The diagrams here are mine. The backend is closed, so this describes the shape of the system rather than its internals.
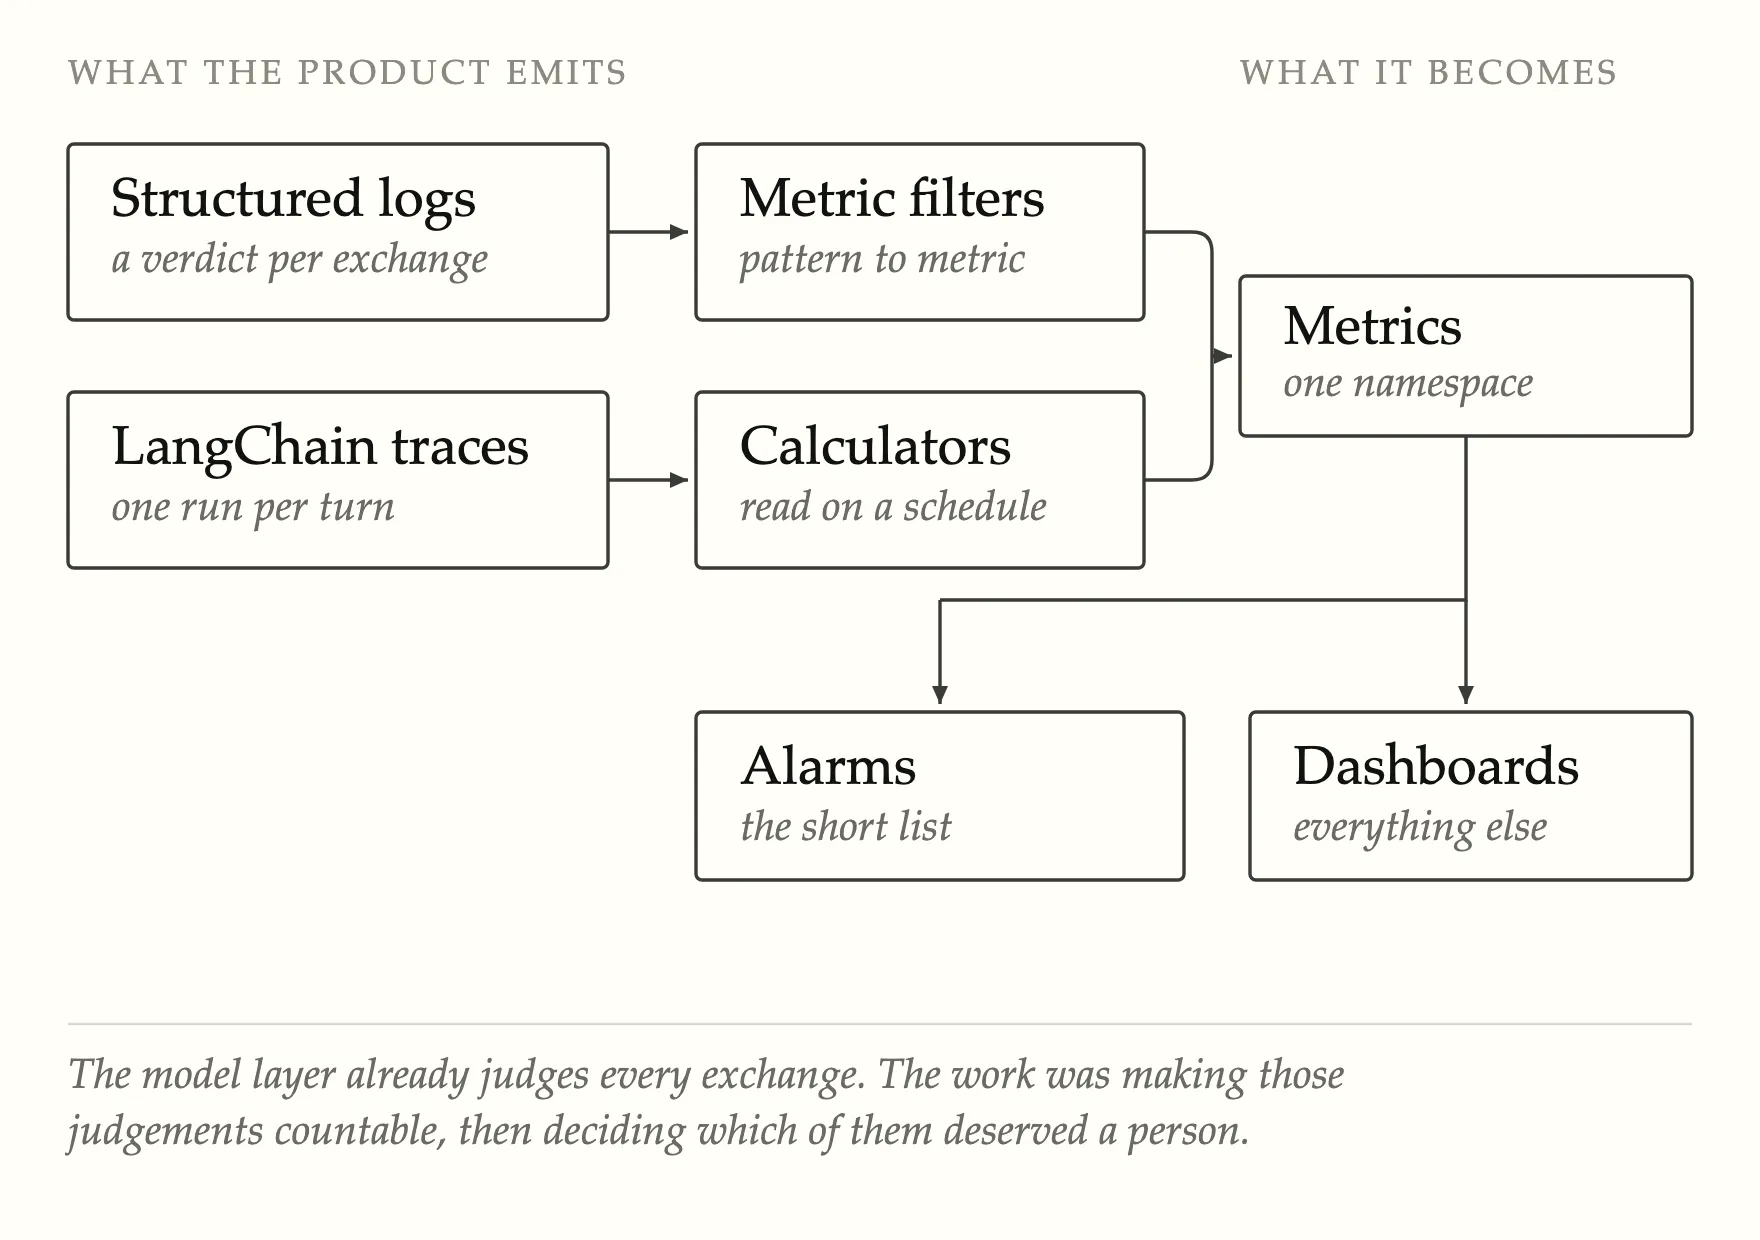
Signals available from the application
The useful signals existed before any of this. The model layer was writing a judgement about every exchange into its logs: whether the reply had tripped content filtering, whether personal data had appeared, whether the request looked like an injection attempt, whether the user’s intent had been understood at all.
The signals were written as structured log fields, so they could not be used directly in metric alarms. Metric filters converted matching log events into time-series metrics that could be graphed and given thresholds.
The second source needed more than a pattern match. The assistant runs on LangChain, and every turn leaves a trace; a scheduled job reads those runs and computes what a pattern could not: how long the exchange was, how many messages deep the conversation had gone, the sentiment of the user’s input and of the model’s reply, and how readable the reply came out.
Both sources wrote to the same metric namespace. Once represented as time series, the signals could use the same dashboards, alarm rules and paging pipeline.
Selecting actionable alarms
Most signals initially had alarms. The alarm set was reduced to conditions that an on-call engineer could act on; other useful signals remained available in dashboards.
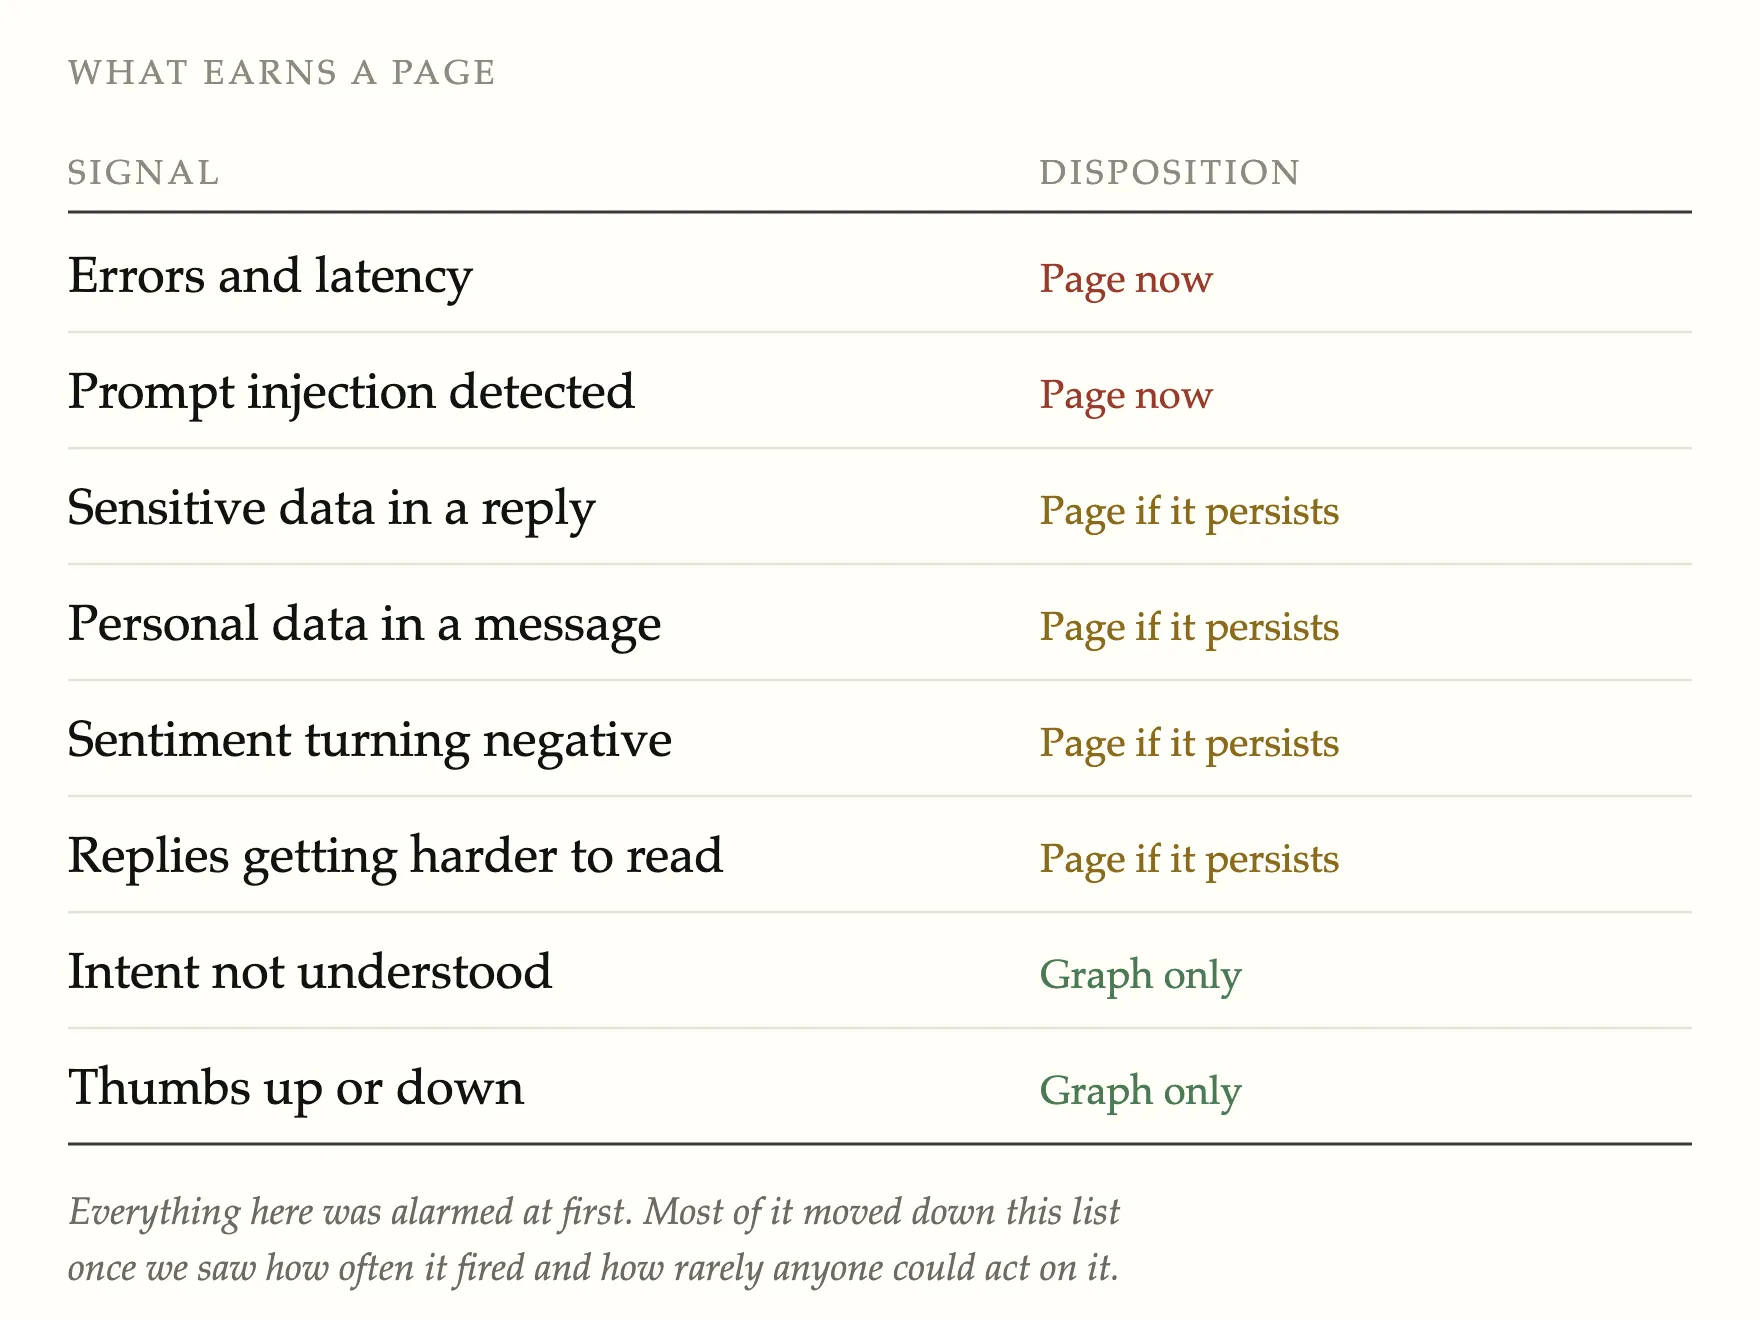
Three kinds of change got it there.
Some alarms used thresholds based on a Gaussian latency distribution. Latency was log-normal, so the long tail caused frequent alerts that did not indicate incidents.
Client and server errors were counted together, although many 4xx responses were expected refusals by the content filter. Separating these metrics stopped expected responses from paging as faults.
Safety metrics emitted data only when a condition matched. The default missing-data setting treated the gaps as breaches and caused alarms to latch; changing it to treat missing data as absent resolved the issue.
Personal-data and sentiment alarms were changed from three bad intervals out of ten to ten out of thirty. They remained monitored but only notified an engineer when the condition persisted. The intent-miss alarm was removed, while its metric remained available in dashboards.
Internal and shareable dashboards
The same metrics fed two dashboards with deliberately different contents. An internal view carried everything, including the sentiment scores. A second, shareable view dropped them.
The shareable dashboard omitted sentiment scores because they could be misinterpreted without context. It was hosted on self-managed Grafana, since the managed service could not share dashboards outside the account.
The assistant has since been retired; this describes the system while it was running.
The product it monitored · Tarmac, the open-source webapp it shipped inside